In 2017, I ran a small set of experiments that asked the question: if the US Senate demographics were the results of a fair process, how (un)likely would the 2017 US be? Spoiler alert: not very likely to come from a fair process in 2017.
Let’s do the same analysis for the 2020 US Senate. You can read about the details of the analysis in the last post. Here are the updated stats: there is still only one Black woman senator in the Senate, still 3 Black senators, 26 women (up from 21), and 6 states that have 2 women senators (up from 3). The US population, according to the 2017 and 2018 ACS, is about 12% Black and 51% women. Some state demographics have had small changes.
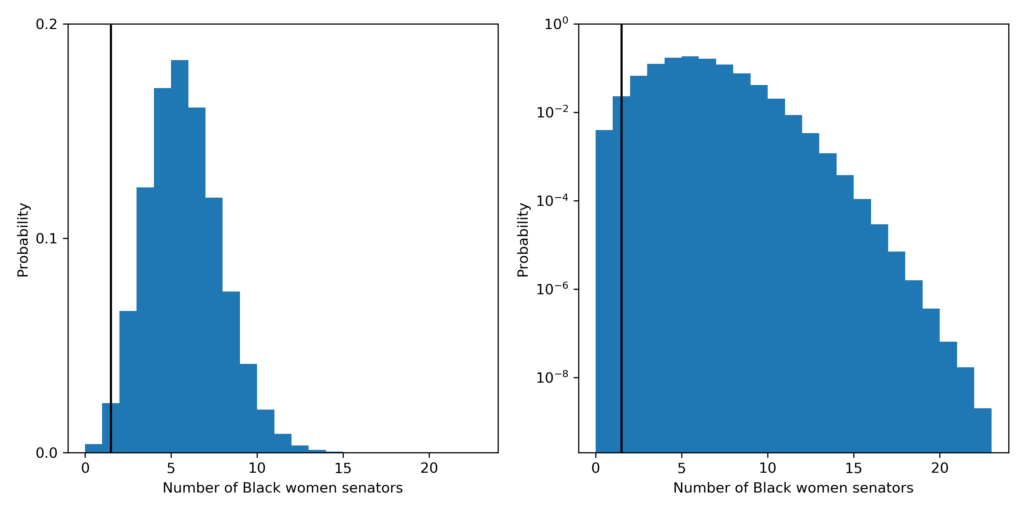
First, let’s look at what the probability is that a fair process produced a Senate with 1 or fewer Black women senators. The probability is about 2.7 in 100. The most likely outcome predicted by a fair process is 5 Black women senators which should happen 18% of the time.
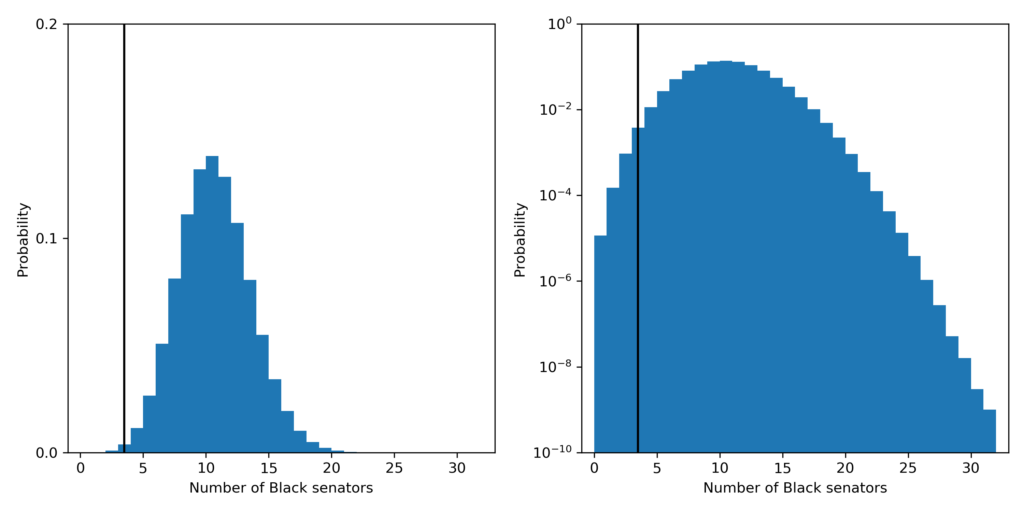
The probability that a fair process led to a Senate with 3 or fewer Black senators is about 4.9 in 1,000. The most likely outcome predicted by a fair process is 10 Black senators which should happen about 14% of the time.
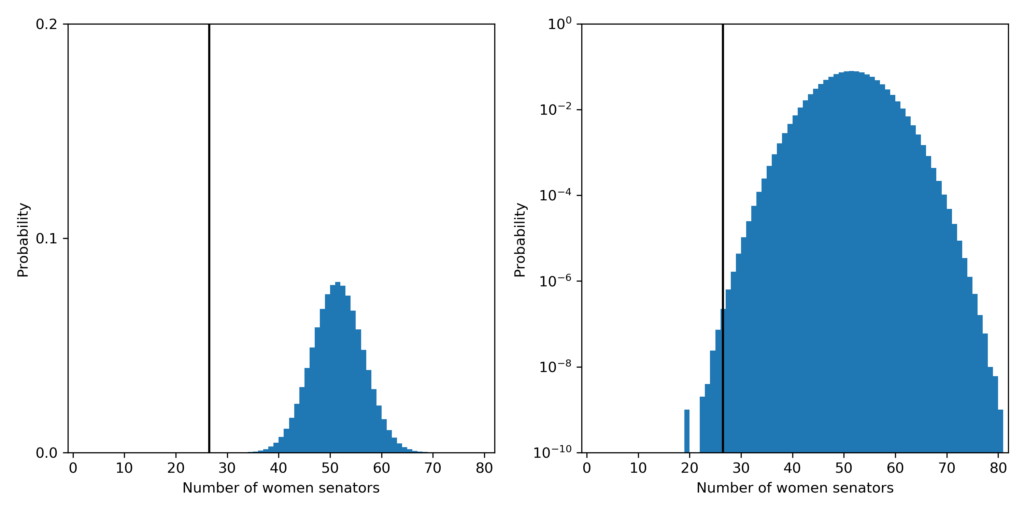
The probability that a fair process led to a Senate with 26 or fewer women senators is about 3 in 10,000,000! The most likely outcome predicted by a fair process is 51 women senators which should happen about 8% of the time.
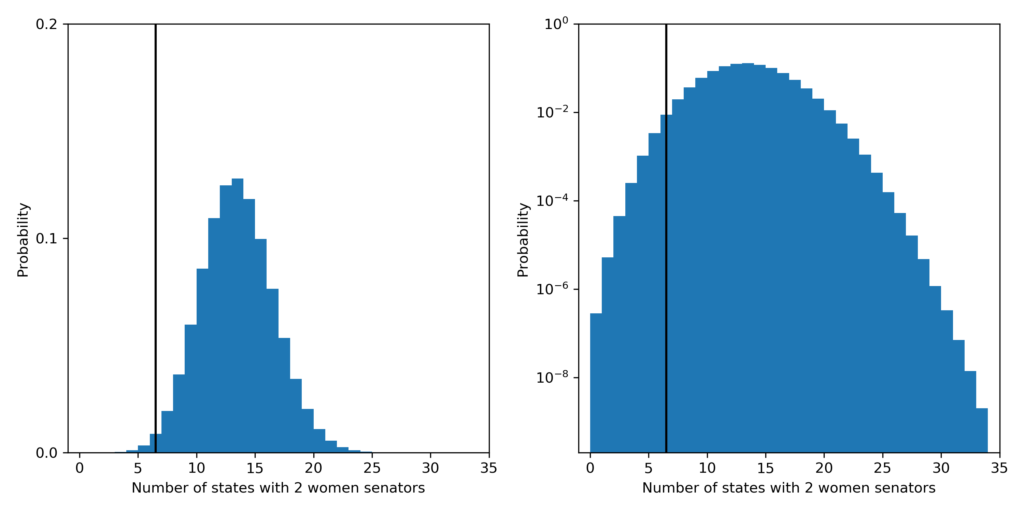
Finally, the probability that a fair process led to a Senate with 3 or fewer states with 2 women senators is about 1.3 in 100. The most likely outcome predicted by a fair process is 13 states with 2 women senators which should happen about 13% of the time.
So what’s changed? Broadly, this shows that becoming a US Senator is not a fair process. It it biased against non-Black women, Black people and Black women. The number of women has significantly increased, but is still not close to a fair fraction. The number of Black senators and Black women senators has not changed. Still more work to do!
You can find the data and code to reproduce these plots here.